Our BI Dashboard Upgrade
We are constantly improving ShiftMatch to meet an ever-changing landscape’s demands and serve you better. So, we’re happy to say that a
new BI Dashboard powered by
Amazon QuickSight is now available.
After a few weeks of hard work, testing, fixing, and tweaking, our
new BI Dashboard is now live and available!
Based on account reviews and user feedback, we decided to completely redesign the existing Dashboard and add new features to help you better coordinate your shift matching.
With these new insights, you can improve some of your internal processes, cut down on message overload, and save money.

Powered by QuickSight
For a considerable time, we have been looking for a BI tool that matches the intuitive user experience we have created in ShiftMatch. Before we found QuickSight, all the tools we looked at needed the user to be a data analyst. We found a solution that was easy to use and didn’t need extra training with QuickSight.
Fast, powerful and intuitive, QuickSight delivers clarity at scale and aligns with our mission to empower people with actionable data to make better business decisions. Managers and staffing coordinators may utilise these simple data visualisations to make data-driven and well-informed decisions.
ShiftMatch has developed over time, and the volume of workforce data available to our customers has increased. Our QuickSight-powered new BI Dashboard gives you instant access to this rich data and enables insightful, data-driven analysis.
The dashboard is divided into internal organisation data and external agency data sets, which may be filtered using the top control panel. A date range, as well as the option to drill down to the site and then division, can be specified.
Messaging summary
Total Messages: the total number of SMS and App alerts issued within the time period indicated.
Total Placements: the total number of shifts filled during the specified time period.
Message to Placement Ratio: the number of messages required to fill an open shift.
Broadcast Messages: the total number of broadcast messages sent within the chosen time period.
Requests vs worked
Acceptance Rate Per Message Total: This shows a breakdown of when shift requests were accepted per message sent. For example, the first request sent out was accepted at 12%, the second request at 8%, and so on. This report is a good indication of worker engagement and shows that more requests don’t necessarily mean better fill rates.
Acceptance Rate Per Message Number Breakdown: Similar to “Acceptance Rate Per Message Total“, but the requests have been subdivided by message type – SMS, App notification, email.
Skill Distribution: This depicts the distribution of skills across the workforce.
Worktype Breakdown: A breakdown of the different types of workers in ShiftMatch, such as casual, part-time, full-time, and so on.
Shortfall Snapshot
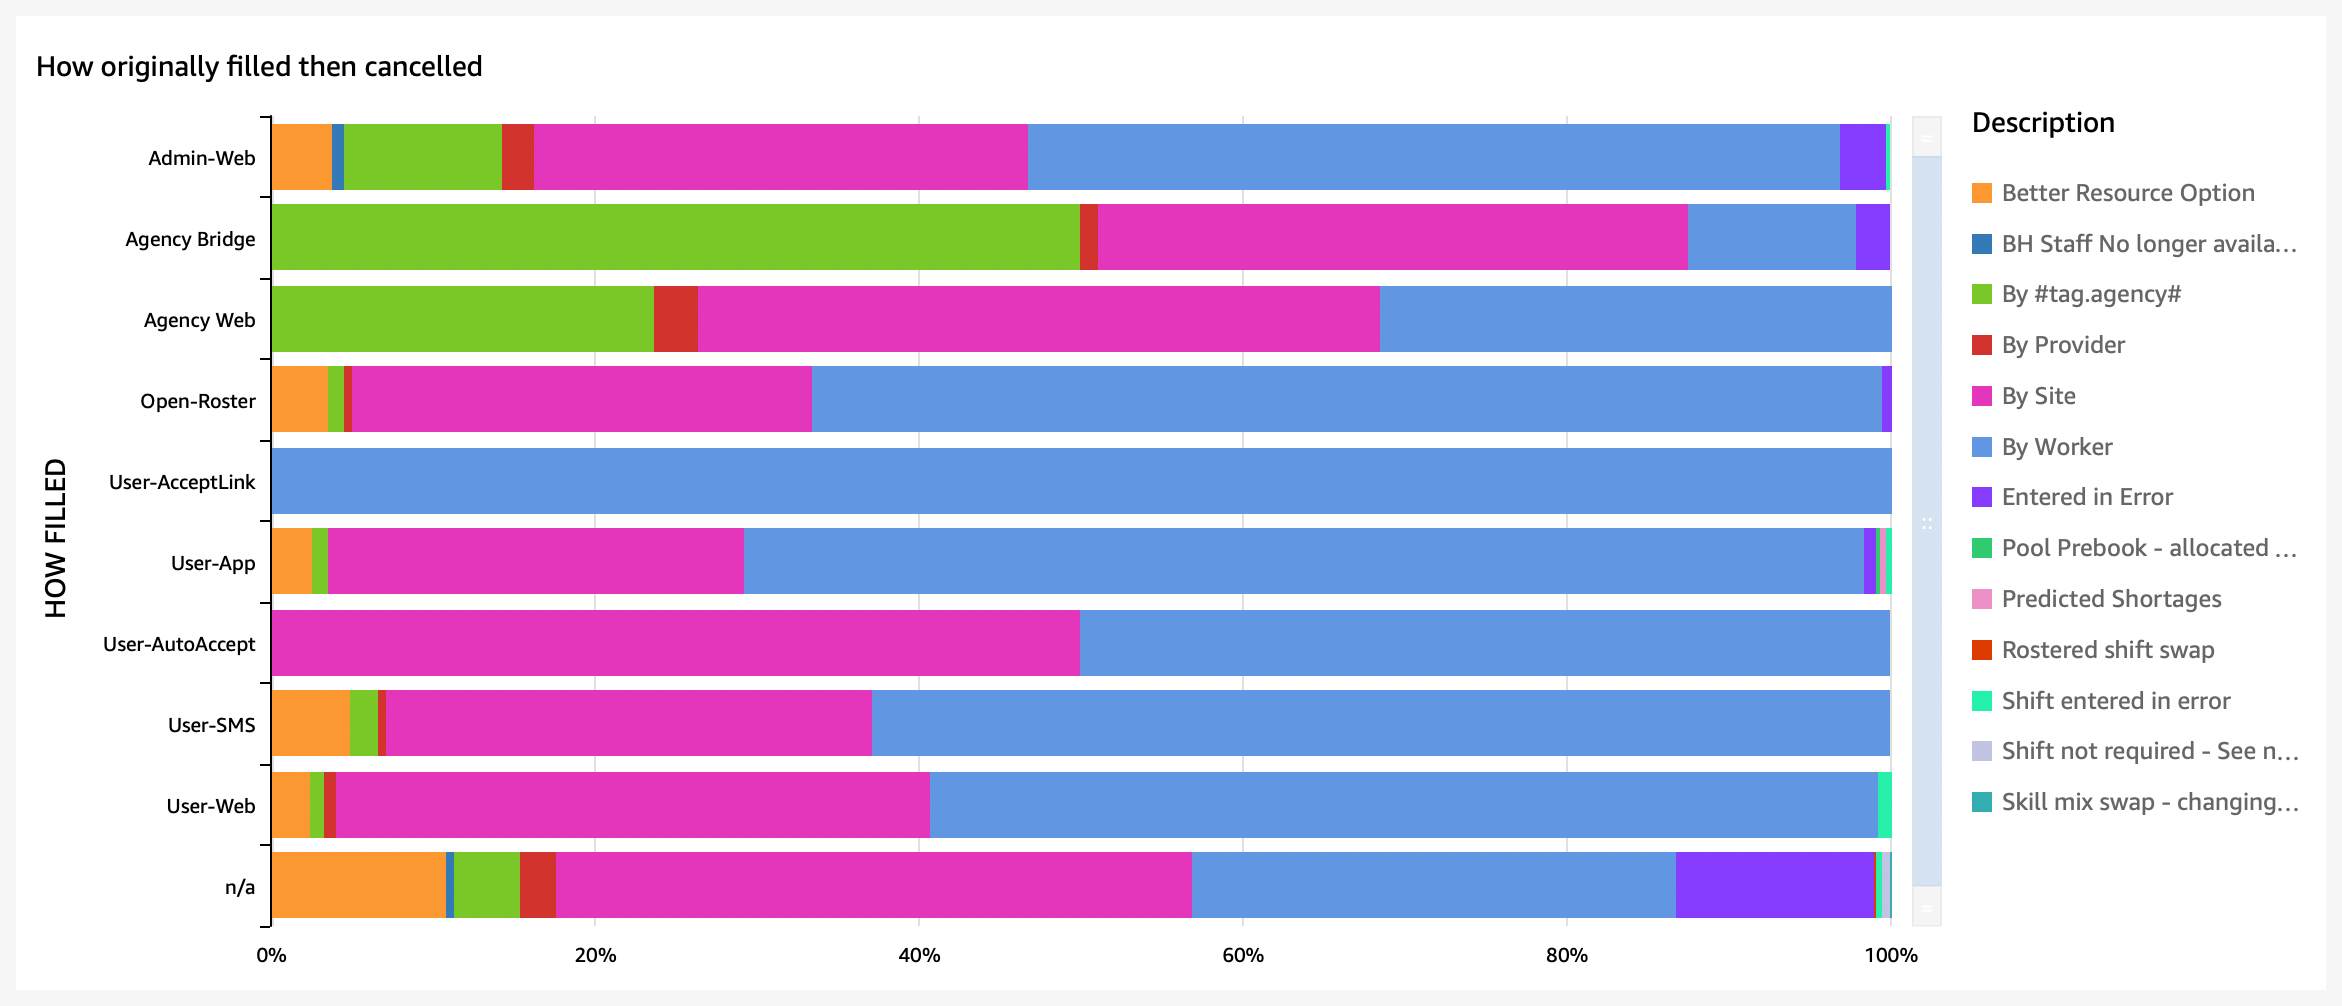
How originally filled then cancelled: This descriptively titled chart graphically displays the reason a filled shift was cancelled. This report is highly dependent on the correct reason code being applied when cancelling a filled shift.
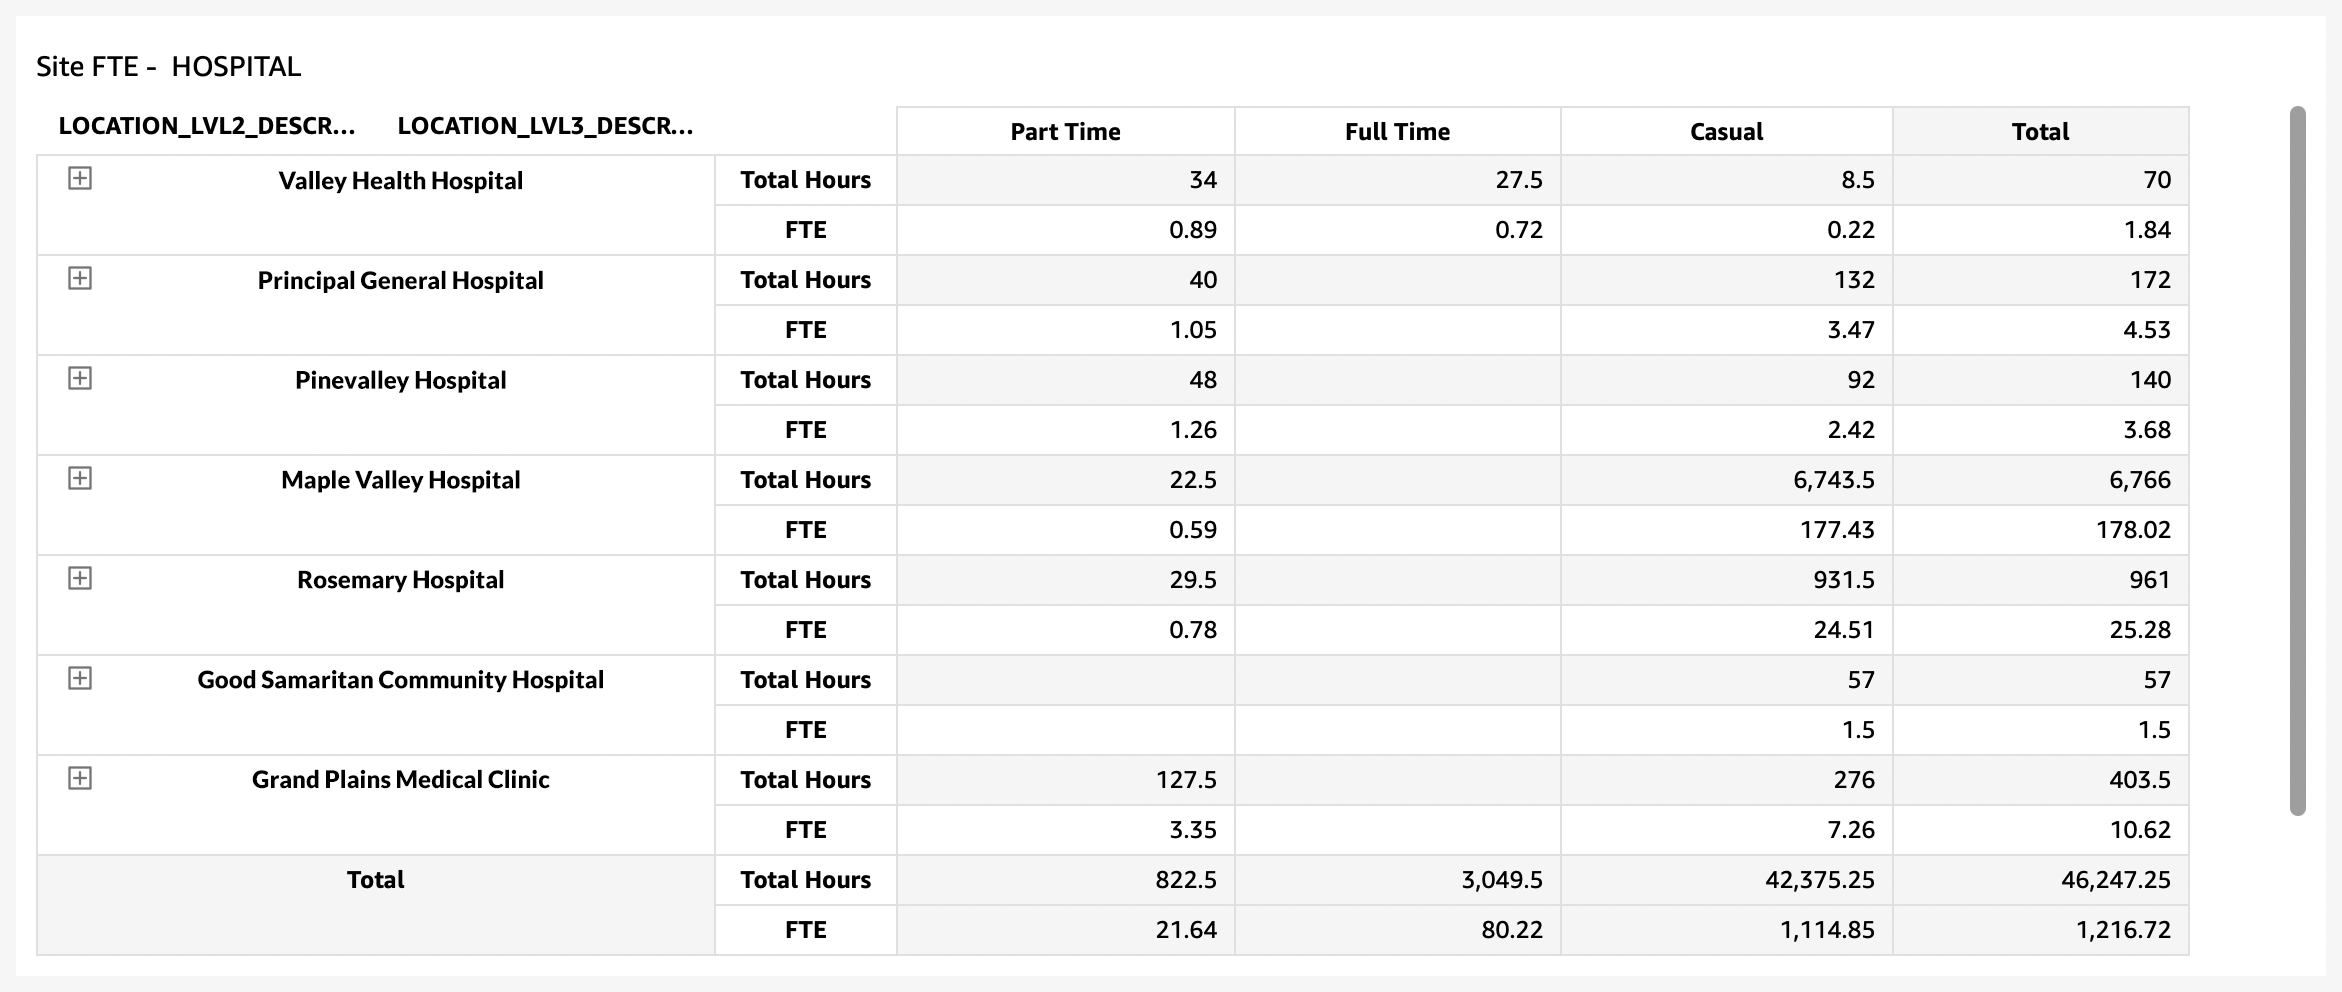
Site FTE: A table showing the total filled shifts as FTE headcount grouped into work type, Casual, Full-time, Part-time or Agency
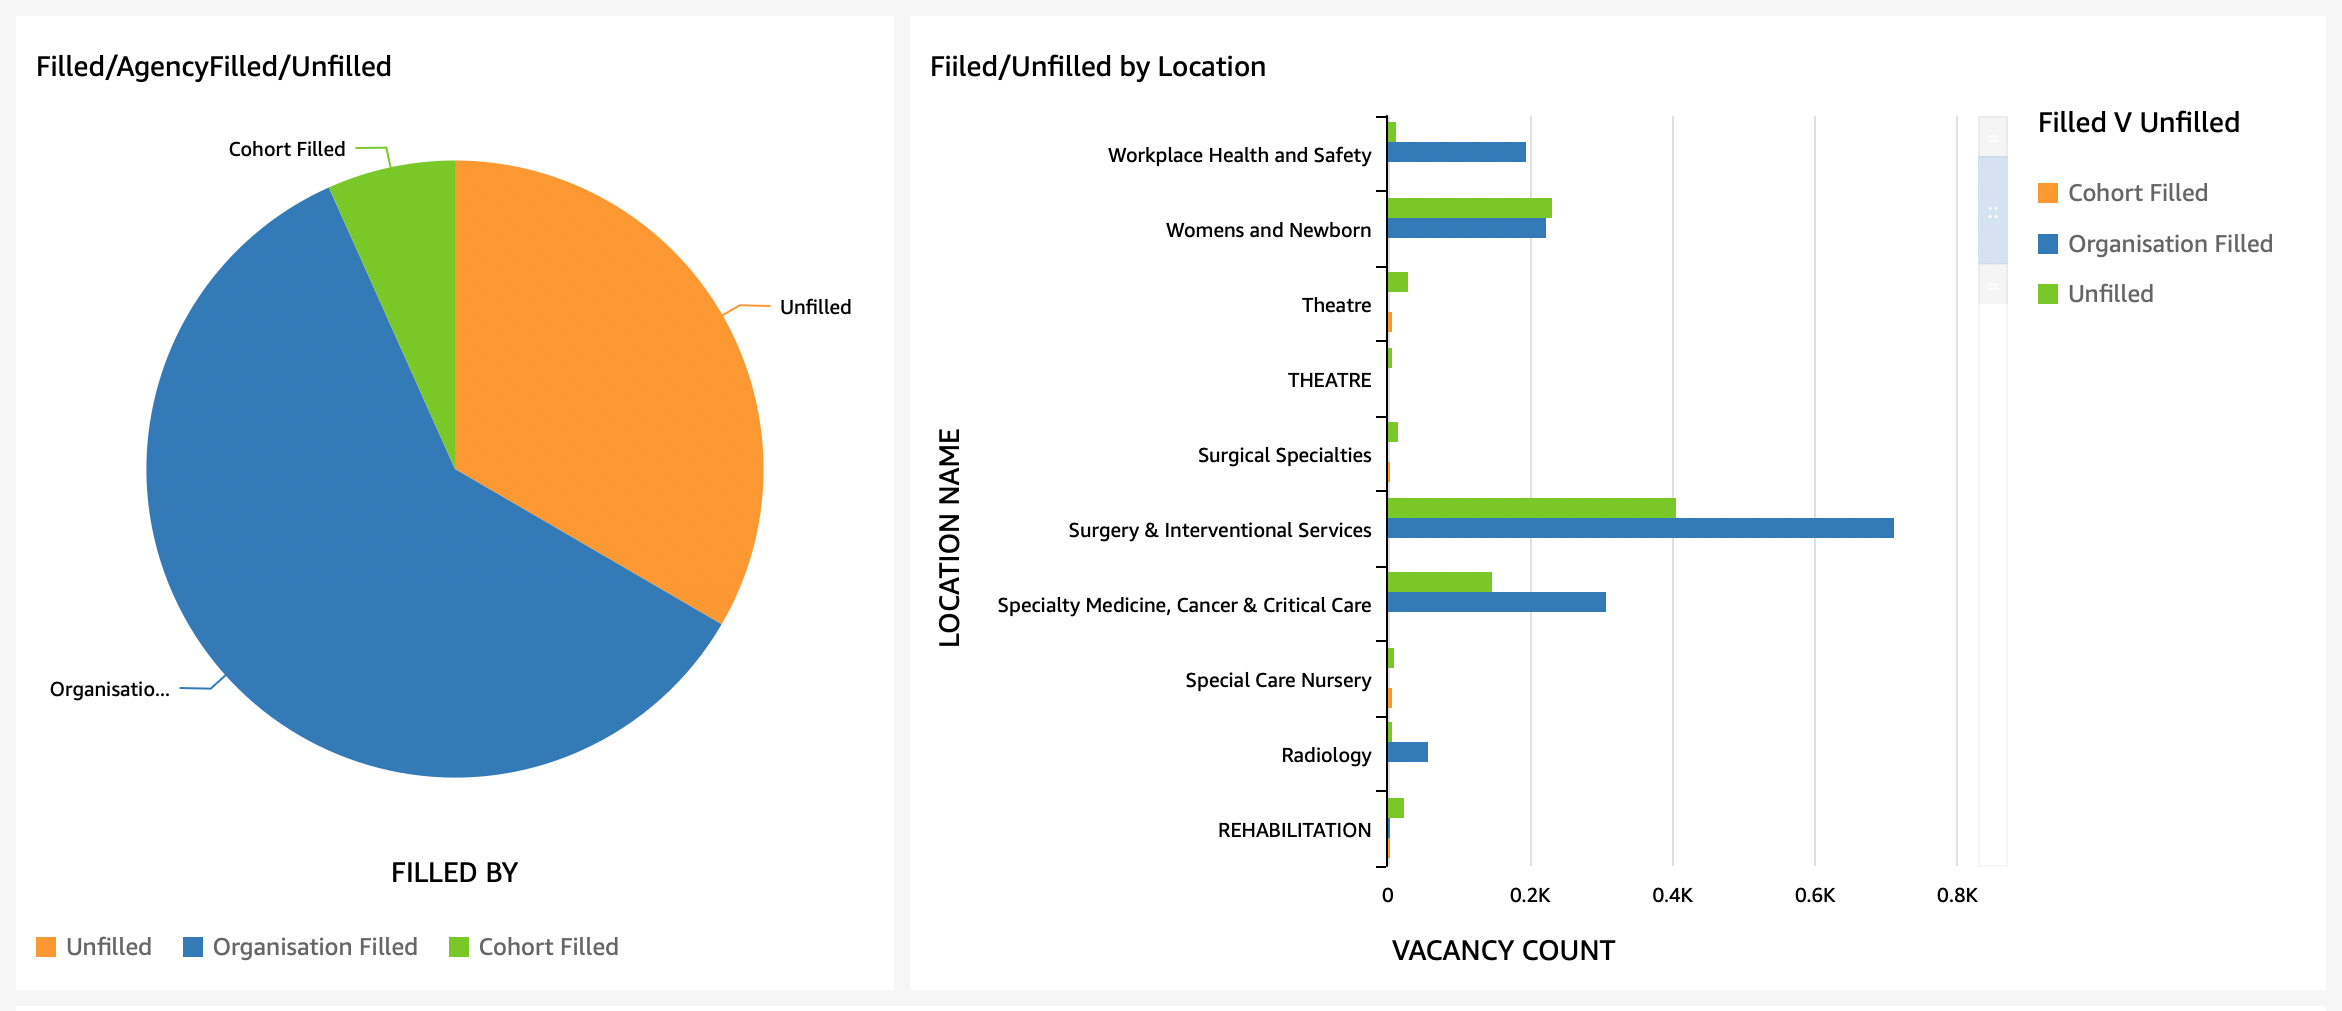
Filled/AgencyFilled/Unfilled: This chart broadly shows where the workers who filled this shift were from. If they are internal staff or from external agencies, and in some instances, filled by a cohort.
Filled/Unfilled by Location: The number of filled and open shifts remaining in ShiftMatch is based on the selected time period and displayed by location.
Availability Summary
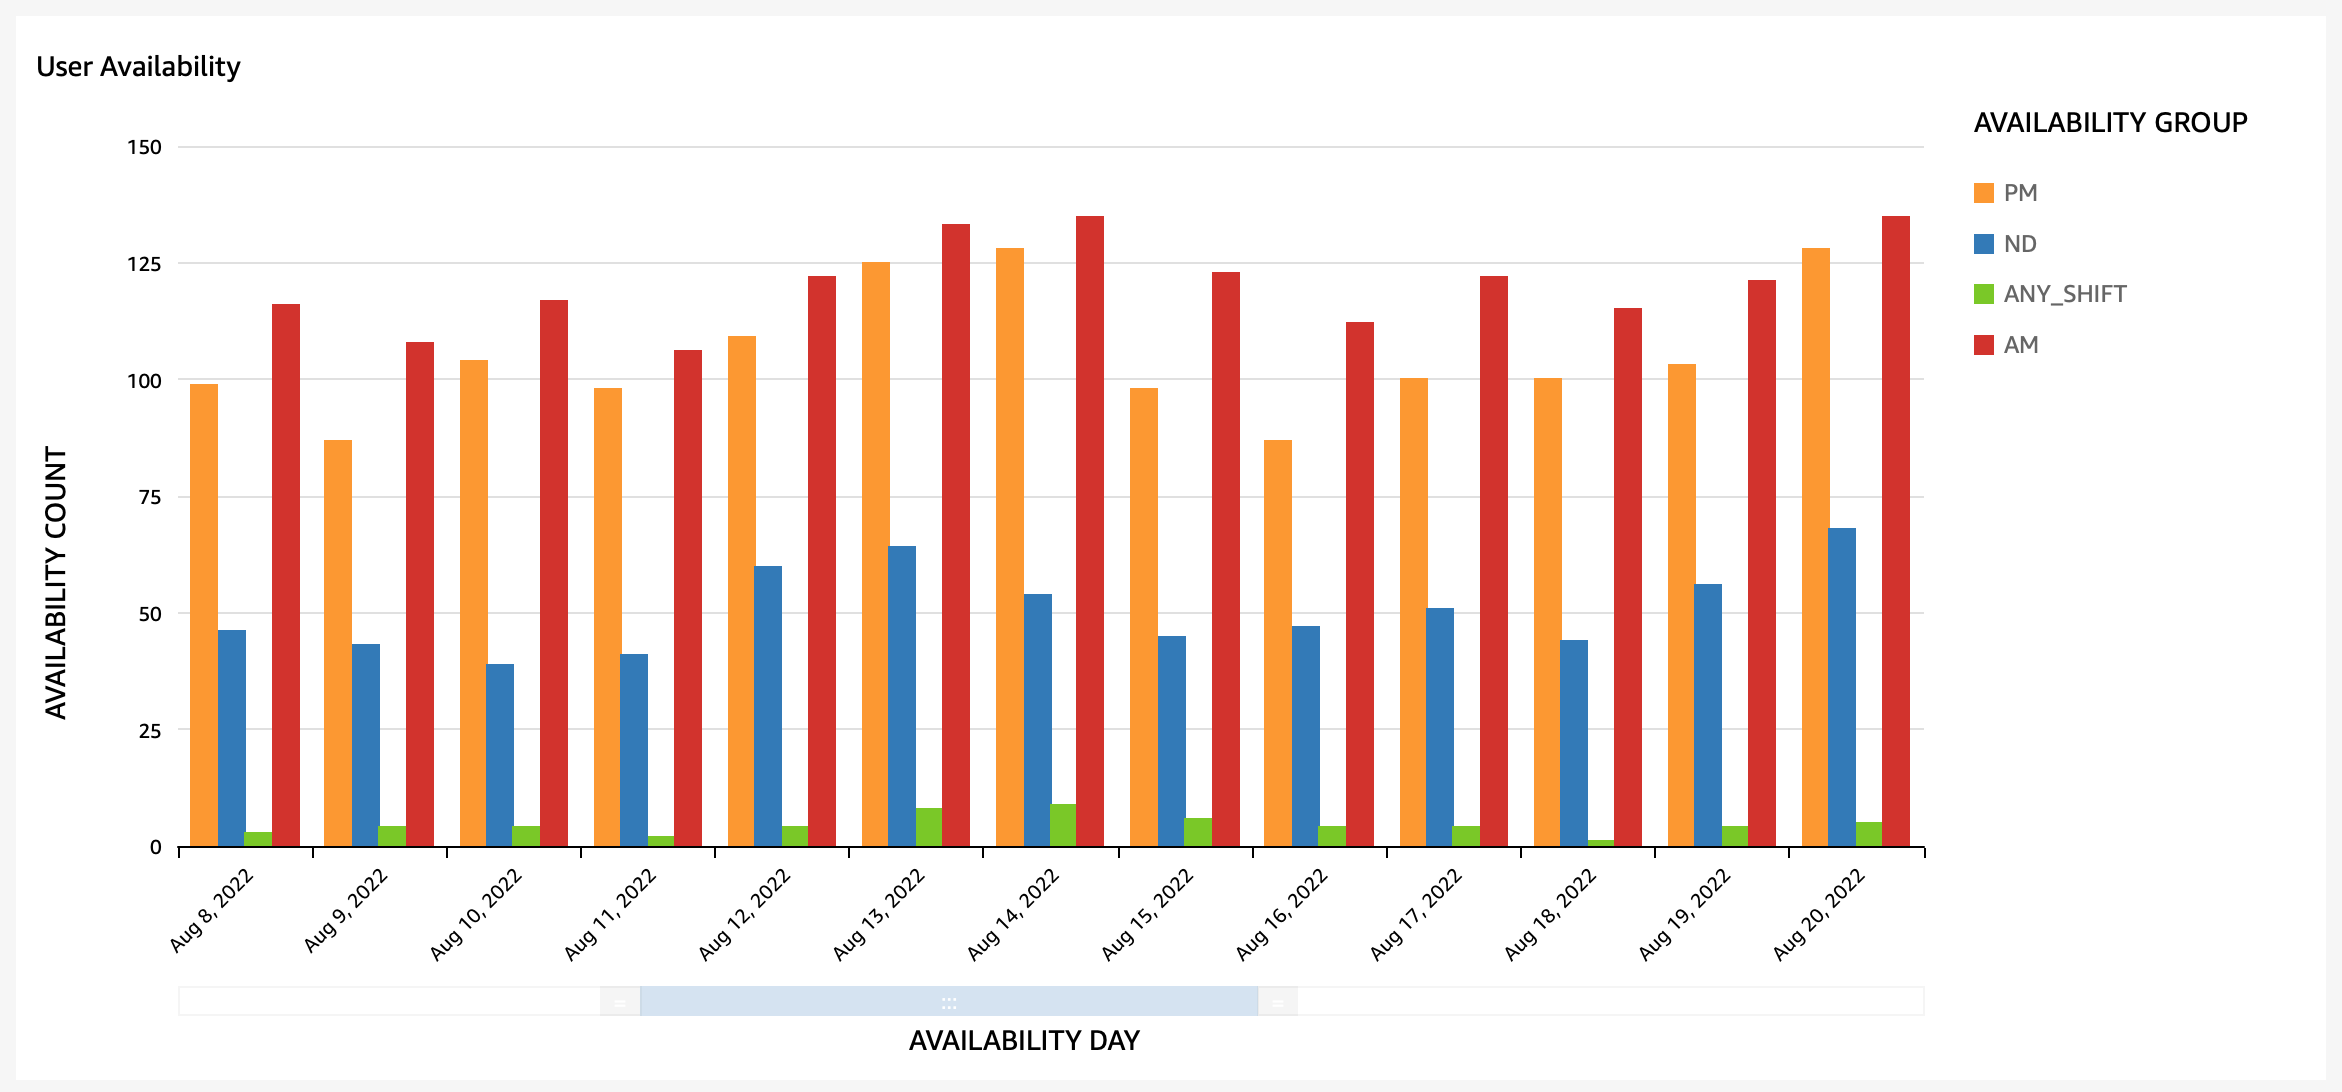
User Availability: The current end-user availability, broken down by shift group, AM, PM, DN, etc., for the given time frame.
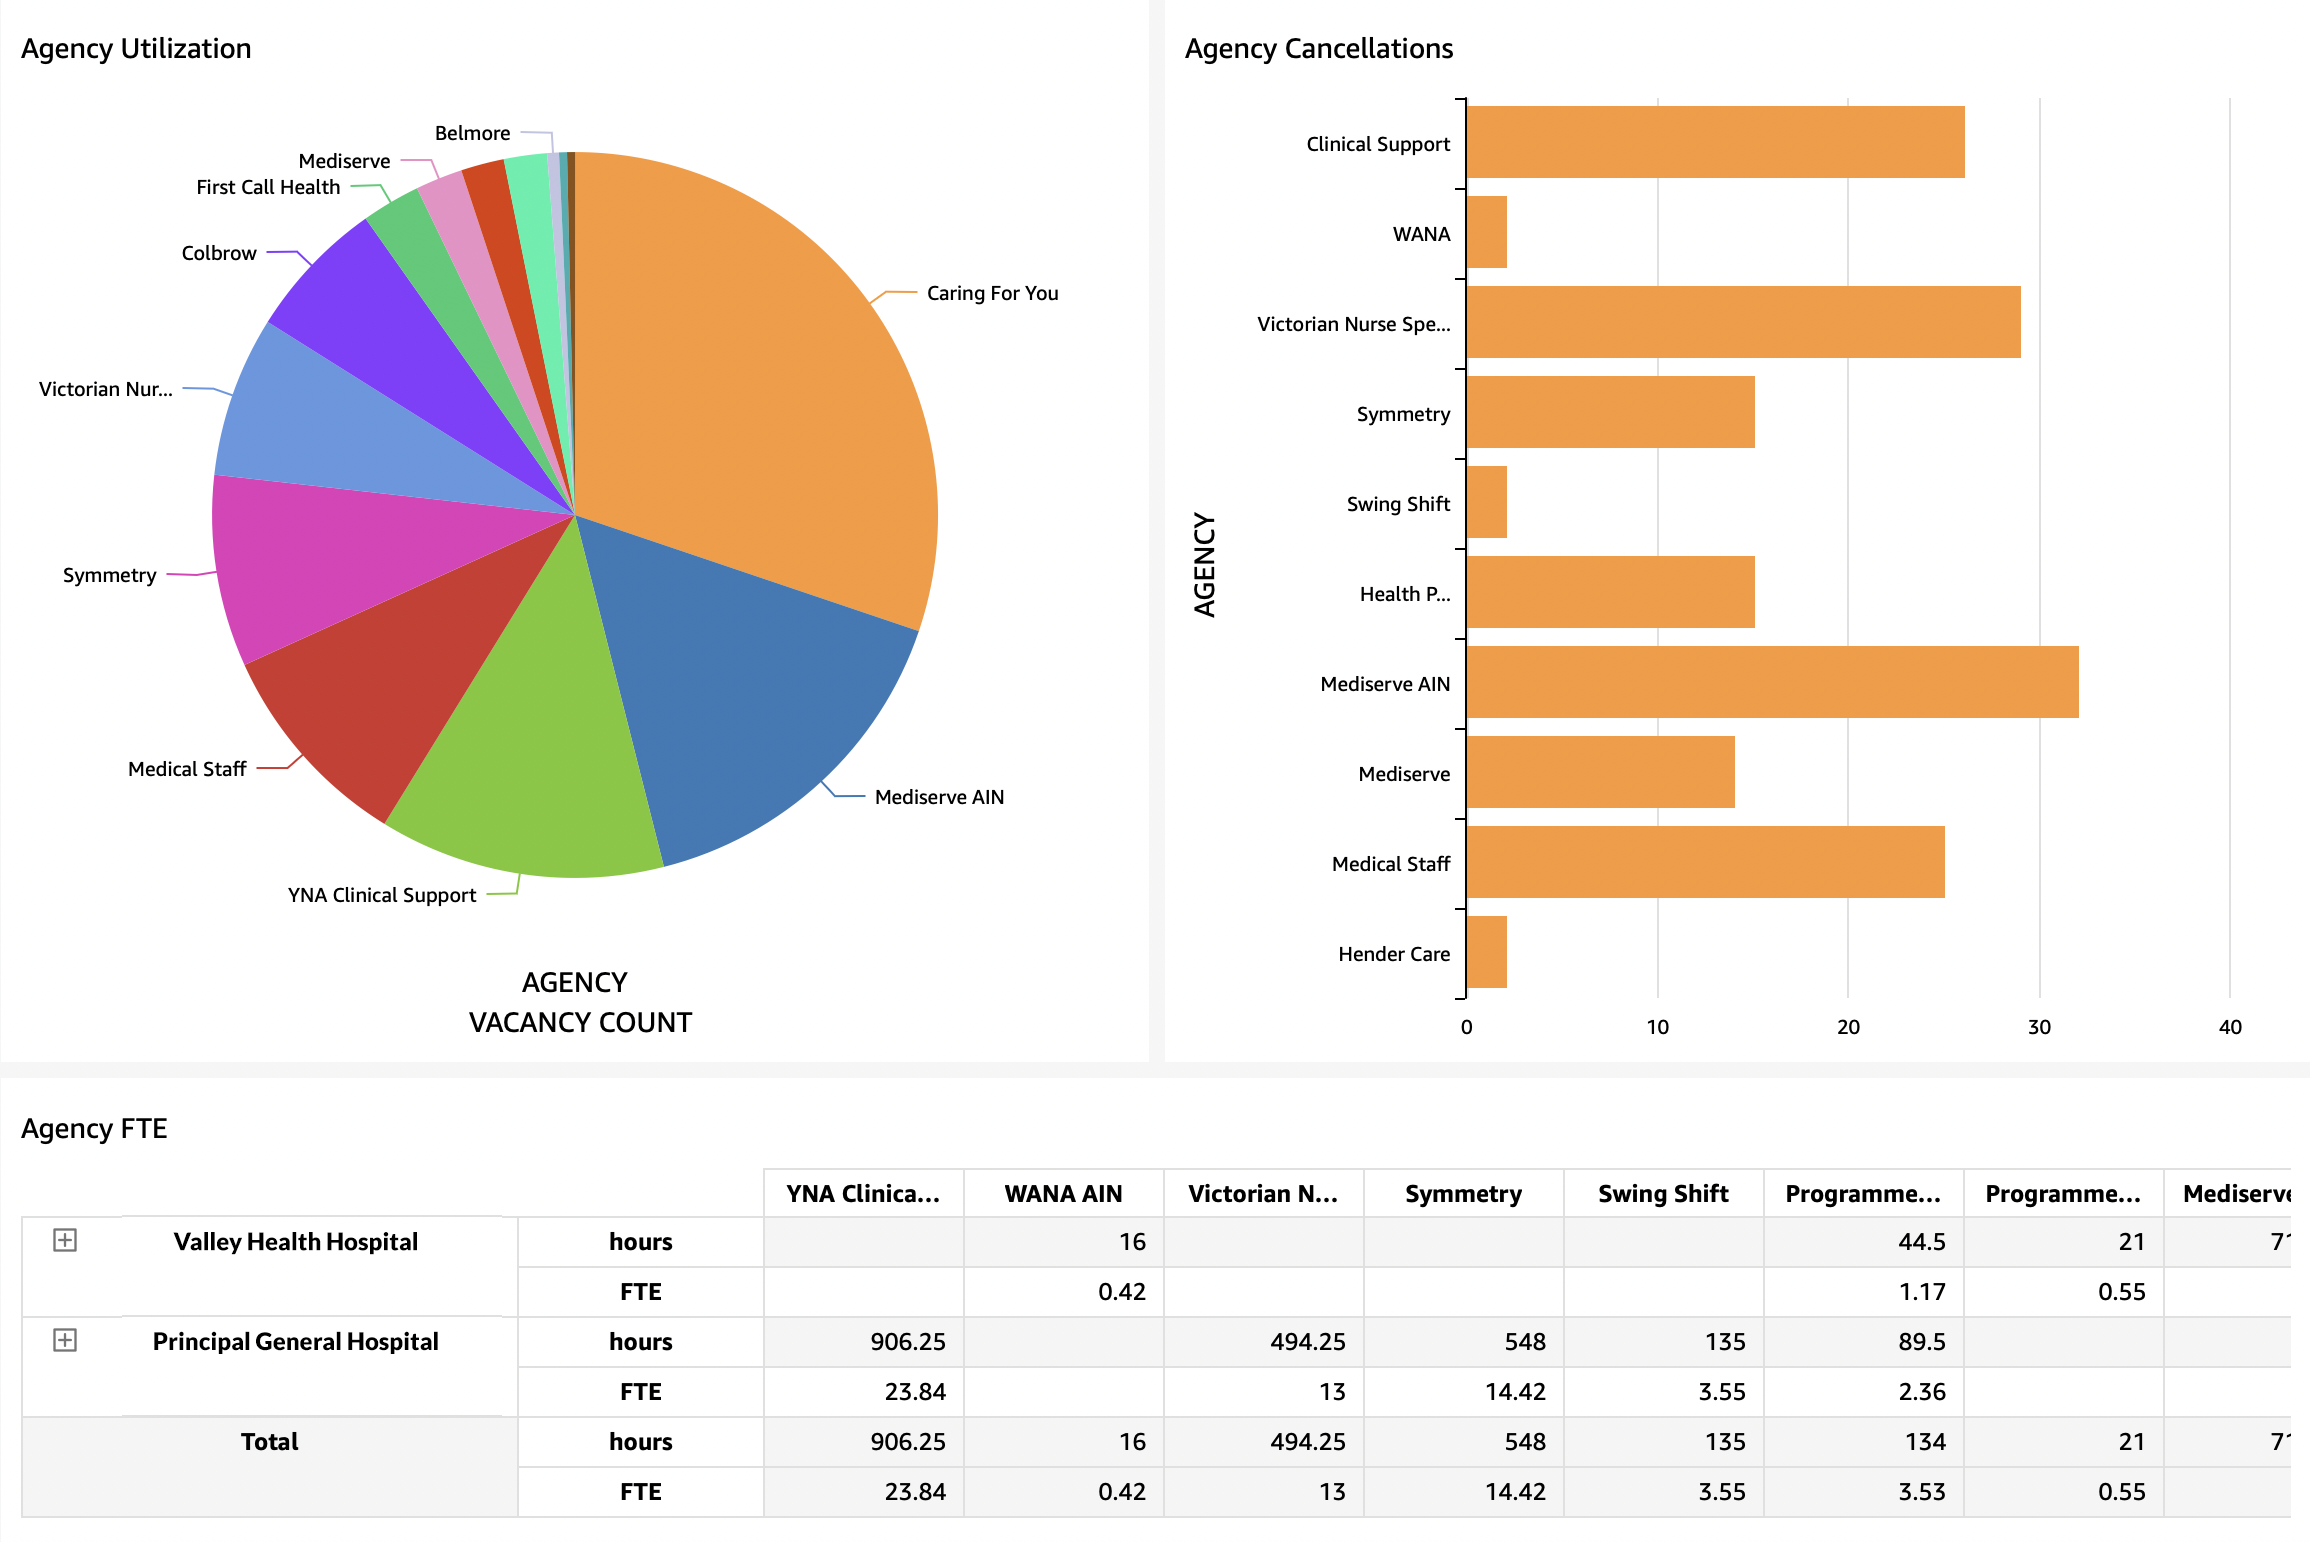
Agency Overview
Agency Utilization: Displaying a breakdown of which external agencies have filled the most shifts for the given time period
Agency Cancellations: By agency, the total number of agency shifts that have been cancelled
Agency FTE by Location: A table showing by location, the Agency usage displayed as FTE headcount.
We have embedded QuickSight directly in ShiftMatch and are beginning to roll it out to our customers. If you already have access, you will find the dashboard under the Admin menu. To request access, contact your manager or email help@shiftmatch.com
The feedback we have received so far has been outstanding. Our customers are extremely happy with the reporting solution provided to them by combining Amazon QuickSight within ShiftMatch.
But as always, we encourage your feedback and look forward to seeing these dashboards grow to meet your future requirements and support you in your business development.
The Finer Details
Dashboard BI reporting via AWS Quicksight is FREE for the first five users, then it is $10 per user per month thereafter.
-
The dashboard allows the approved managers to filter data on a large scale via a large dashboard (data analytics).
-
Users can download PDFs from Quicksight. Users can also download CSV’s of information that they have filtered out.
-
Availability can be viewed 90 days.
-
Shifts can be viewed -500 days + 900 days.
-
New data is loaded at 12 am each day.
-
‘Location limited’ – Users can only see reports with the locations allocated to them.
To request access, contact your manager or email help@shiftmatch.com
ShiftMatch matches open shifts with the best candidates from the internal relief pool and the external contingent workforce. ShiftMatch streamlines workforce management by intelligently distributing Open Shifts to the best-matched workers. ShiftMatch helps you save time and money.


